If you love custom reports, Moodle Workplace 5.0 is packed with features that make reporting faster, clearer, and more visually engaging — with no spreadsheet exports needed.
Duplicate Reports in a Click
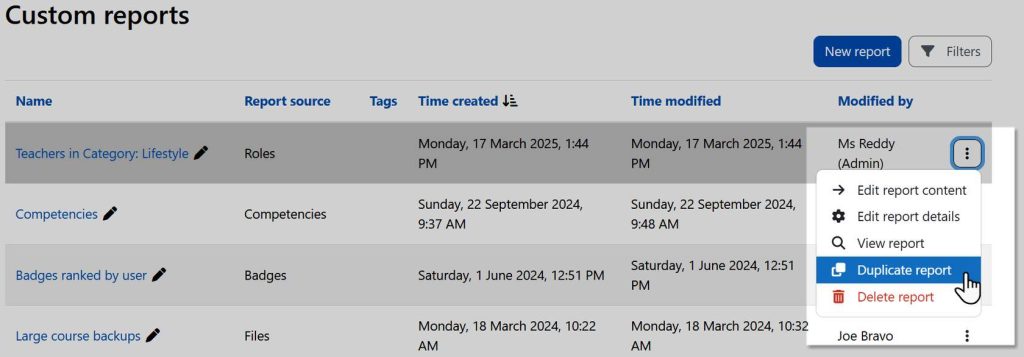
Need a similar report for a different audience? You can now duplicate any custom report quickly by clicking the three-dot menu. No need to start from scratch!
Visual Reports on Any Page
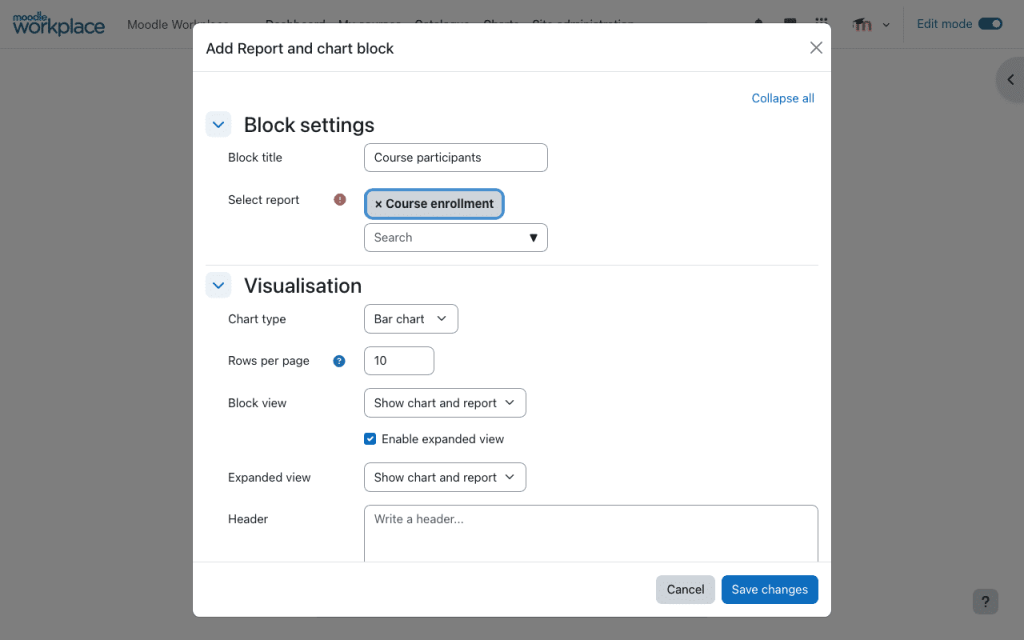
The new Report and Chart block allows you to display real-time data visually using bar, line or pie charts — directly on your Dashboard or Custom pages. You can choose:
- Chart, table, or both
- Responsive layout that fits perfectly on any screen
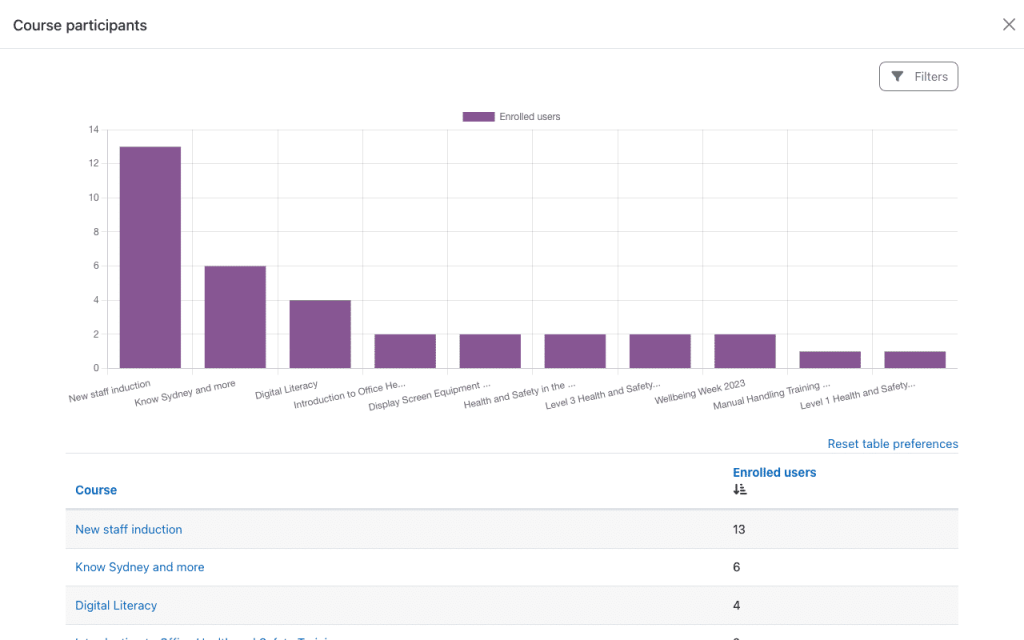
- Fullscreen view to focus on insights without distractions
Custom Layouts and Filters
Configure layouts using aspect ratios or JSON, and switch between table and card views. Plus, interactive filters mean users can explore reports live, right within Moodle.
Explore this now…
Head to your Dashboard or a Custom page, and try adding the new Report and Chart block. Choose your favourite report and watch your data come to life.
Looking for inspiration? Try a “Course Participants” or “Program users allocation and completion” report and show completions as a chart — it’s a hit with managers!